- home
- Sample 2024
- The Sixty-Two Year Scorecard

The Sixty-Two Year Scorecard
Sample 2024February 2024
Each year at this time, we consider the performance of the mainstream equity market—absolutely, and relative to consumer inflation—in the lifetime of a person reaching average retirement age (62) during the coming year.
Clients turning 62 in 2024 were born in 1962—the year the Beatles auditioned for Decca Records and were rejected, John Glenn became the first American to orbit the earth, Marilyn Monroe died, the New York Yankees won the World Series for the twentieth time, and—in the Cuban Missile Crisis—the world came closer to thermonuclear oblivion than at any time before or since.
So we ask three questions:
• Where did the S&P 500 close out the year just past, relative to where it ended in 1962?
• Critically important to our clients on the cusp of retirement: how much did the Index pay in cash dividends last year versus 1962?
• And how did both price performance and the trend of dividend payments compare to consumer inflation—which, in a two-person, three-decade retirement, will be what matters most.
And the answers:
• The S&P 500 closed out 1962 at 63. It ended this past year at 4,770.
• The cash dividend paid out during 1962 was $2.15. Last year it was $70.30.
• The Consumer Price Index ended 1962 at 30. It closed out 2023 at 307.
Thus the 62-year scorecard, in round numbers:
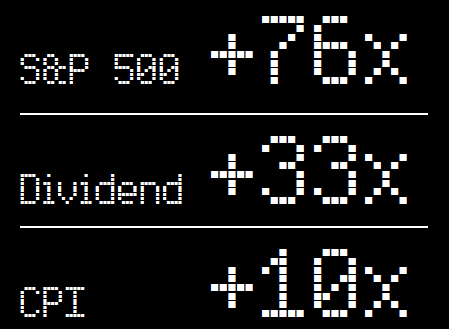
I never cease to be inundated, as you are, by mind-numbingly complex charts/graphics visualizing how much more—and for how much longer—stock prices have advanced as opposed to declining. As often as not, I can't even decipher them; even when I can, I don't imagine the so-called “risk-averse investor” will find them compelling, much less convincing.
But if you told me that, for the rest of an advisory career, I would only be allowed to show the prospective client one single visual, this would surely be it.
Personalizing the long-term equity experience—rooting it firmly in their specific lifetimes—makes the critical point as powerfully as it can be made. Namely, that for their entire lives, mainstream equities have been the simplest and most effortless way of building real (net of inflation) wealth while generating cash dividend income in retirement that grows at a significant premium to the inflation rate.
In this as in all that we do, the more complex our illustrations are, the less likely they are to strike the prospect's heart. In this as in all that we do, we are best advised to follow single-mindedly the three great rules of effective client communication:
• Simplify it.
• Humanize it.
• Personalize it.
The issue is never how much longer equities go up—nor how much—than they go down. That's at best a secondary, and may even be a tertiary, concern. Indeed, once the investor can be brought into genuine emotional (as distinct from intellectual) contact with the long-term miracle that is mainstream American equities, the less he/she may actually care about that issue at all.
The great challenge to us advisors is to help people understand, once and for all, why they need to own equities continuously for the rest of their lives. The Lifetime Scorecard method of presentation remains by far the best way I've ever found to do that.
Promise yourself yet again that you will never go into a serious retirement planning meeting again without knowing what year your prospect was born, and thus able to show him specifically how brilliantly equities have been nurturing people for his/her whole life.